Inhaltsverzeichnis
gnuplot
Beispiele
Interaktiv
gnuplot
Stapelverarbeitung
Diagramm mit den Daten aus einer Datei
Beispieldaten: force.dat
set title 'Gewerkschaftliche Beratung Statistik 2015 - Beratungen'

set grid ytics lt 0 lw 1 lc rgb '#bbbbbb'
set grid xtics lt 0 lw 1 lc rgb '#bbbbbb'

set ylabel 'Anzahl Beratungen'
set xlabel 'Monate 2015'

set xdata time
set timefmt '%m'
set format x '%B'

set yrange [0:9]

plot 'force.dat' using 1:2 title 'Regelm. Beratungen' with linespoints lw 2 dt 2, 'force.dat' using 1:3 title 'Ausserplanm. Beratungen' with linespoints lw 2 dt 3, 'force.dat' using 1:4 title 'E-Mail-Beratungen' with linespoints lw 2 dt 4 lt 7, 'force.dat' using 1:5 title 'Gesamt' with linespoints lw 2 lt 8
Barchart
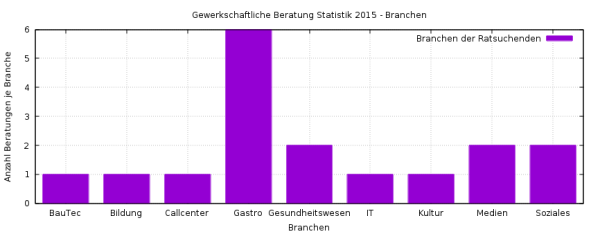
Beispieldaten: branchen.dat
set title 'Gewerkschaftliche Beratung Statistik 2015 - Branchen'

set grid ytics lt 0 lw 1 lc rgb '#bbbbbb'
set grid xtics lt 0 lw 1 lc rgb '#bbbbbb'

set ylabel 'Anzahl Beratungen je Branche'
set xlabel 'Branchen'

set boxwidth 0.75
set style fill solid

set yrange [0:*]

plot "branchen.dat" using 2:xtic(1) title 'Branchen der Ratsuchenden' with boxes
Barchart
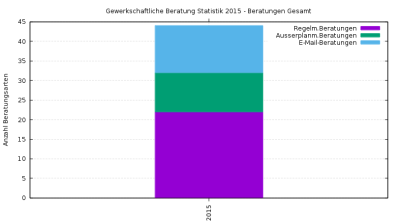
Beispieldaten: monatsdata-gesamt.dat
set title 'Gewerkschaftliche Beratung Statistik 2015 - Beratungen Gesamt'

# Make the x axis labels easier to read.
set xtics rotate out
# Select histogram data
set style data histogram
# Give the bars a plain fill pattern, and draw a solid line around them.
set style fill solid border

set grid ytics lt 0 lw 1 lc rgb '#bbbbbb'
set grid xtics lt 0 lw 1 lc rgb '#bbbbbb'

set ylabel 'Anzahl Beratungsarten'

set style histogram rowstacked
set boxwidth 0.6 relative
plot for [COL=2:4] 'force-gesamt.dat' using COL:xticlabels(1) title columnheader
Barchart
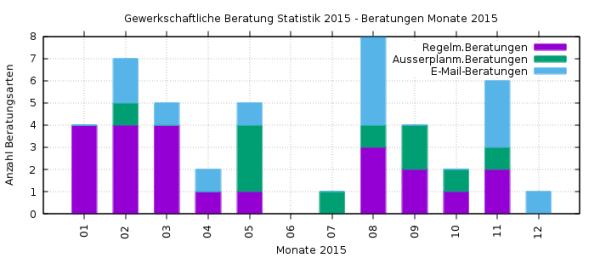
Beispieldaten: monatsdata-gesamt-monat.dat
set title 'Gewerkschaftliche Beratung Statistik 2015 - Beratungen Monate 2015'

# Make the x axis labels easier to read.
set xtics rotate out
# Select histogram data
set style data histogram
# Give the bars a plain fill pattern, and draw a solid line around them.
set style fill solid border

set grid ytics lt 0 lw 1 lc rgb '#bbbbbb'
set grid xtics lt 0 lw 1 lc rgb '#bbbbbb'

set ylabel 'Anzahl Beratungsarten'
set xlabel 'Monate 2015'

set style histogram rowstacked
set boxwidth 0.6 relative
plot for [COL=2:4] 'force-gesamt-monat.dat' using COL:xticlabels(1) title columnheader


