linux:gnuplot
Dies ist eine alte Version des Dokuments!
Inhaltsverzeichnis
gnuplot
Beispiele
Interaktiv
gnuplot
Stapelverarbeitung
Diagramm mit den Daten aus einer Datei
Beispieldaten: force.dat
set title 'Gewerkschaftliche Beratung Statistik 2015 - Beratungen'

set grid ytics lt 0 lw 1 lc rgb '#bbbbbb'
set grid xtics lt 0 lw 1 lc rgb '#bbbbbb'

set ylabel 'Anzahl Beratungen'
set xlabel 'Monate 2015'

set xdata time
set timefmt '%m'
set format x '%B'

plot 'force.dat' using 1:2 title 'Regelm. Beratungen' with lines lw 2 dt 2, 'force.dat' using 1:3 title 'Ausserplanm. Beratungen' with lines lw 2 dt 3, 'force.dat' using 1:4 title 'E-Mail-Beratungen' with lines lw 2 dt 4 lt 7, 'force.dat' using 1:5 title 'Gesamt' with lines lw 3 lt 8
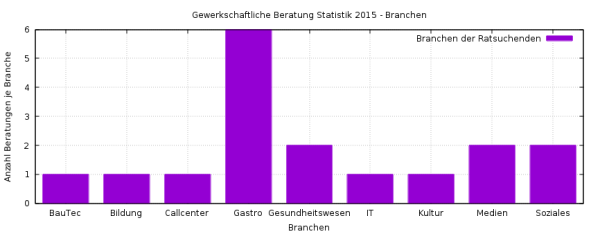
Barchart
Beispieldaten: branchen.dat
set title 'Gewerkschaftliche Beratung Statistik 2015 - Branchen'

set grid ytics lt 0 lw 1 lc rgb '#bbbbbb'
set grid xtics lt 0 lw 1 lc rgb '#bbbbbb'

set ylabel 'Anzahl Beratungen je Branche'
set xlabel 'Branchen'

set boxwidth 0.75
set style fill solid

set yrange [0:*]

plot "branchen.dat" using 2:xtic(1) title 'Branchen der Ratsuchenden' with boxes
Weblinks
Tutorials
linux/gnuplot.1449201040.txt.gz · Zuletzt geändert: (Externe Bearbeitung)


